The Dashboard Is Your Panel.
Operational AI Flies the Plane.
Reporting tells you what happened. Operational AI tells you what’s happening — and what’s next. Clinical trials were never a spreadsheet-and-dashboard problem.
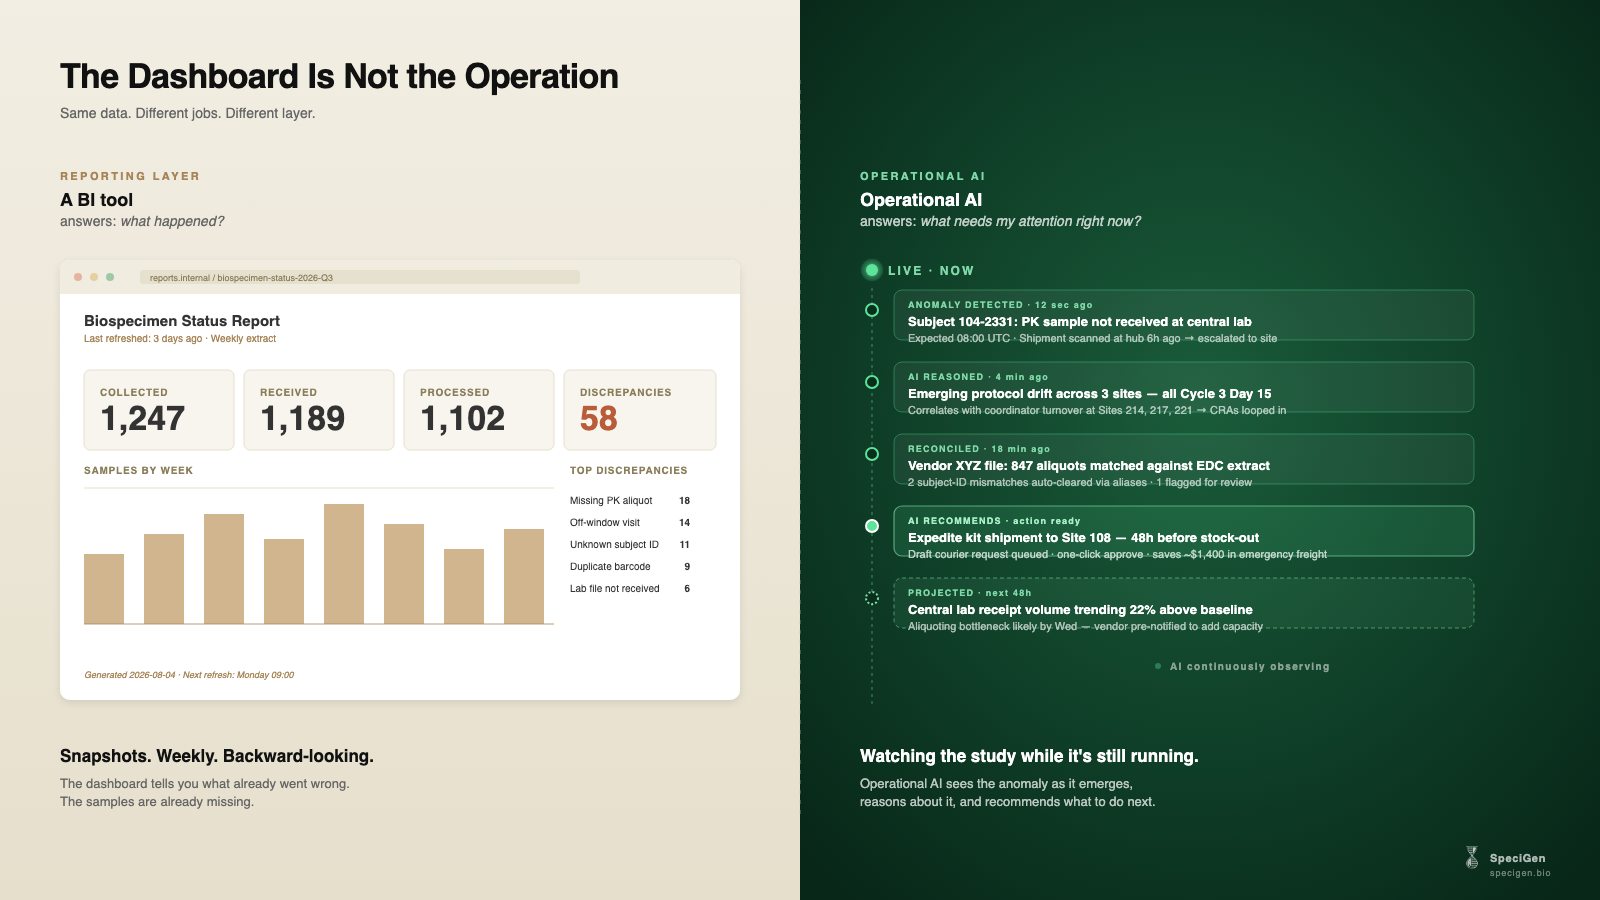
The category mistake
Many clinical operations organizations have concluded, reasonably, that if their study data lives in a warehouse and their BI team is good, then a well-built BI dashboard should be enough to run biospecimen operations. It is a natural conclusion, and it produces genuinely useful dashboards. But it also produces a subtle, expensive category error.
Business Intelligence tools are excellent instruments. Tableau, Power BI, Spotfire, Looker, Sigma, Domo, ThoughtSpot — each is a fine platform. Analysts build beautiful things in them. Executives get answers they need. The problem isn’t the tools. The problem is asking those tools to be something they are not designed to be.
A BI tool is a reporting layer. It reads from a warehouse, computes an answer, and shows you a picture of what has already happened. It refreshes on a schedule — nightly, weekly, sometimes hourly if the pipeline is well-engineered. It renders that answer as a chart, a table, or a KPI tile. It is, by architectural intent, a read-only observer of a past state.
A biospecimen operation is not a past state. It is an ongoing physical process, distributed across independent organizations, moving in real time, and full of decisions that need to be made before the report is available.
Two layers, doing very different jobs
The clearest way to see the distinction is to line up the questions each layer is designed to answer.
- How many samples did we collect last month?
- Which sites are trending high on discrepancies?
- What’s our week-over-week receipt rate?
- Show me the QC failure distribution for the quarter.
- Was our vendor SLA met in Q2?
- Which specific PK sample is currently overdue at central lab — and where is it?
- Is Site 214 developing a pattern of off-window visits right now?
- Will Site 108 run out of kits before the next shipment arrives?
- Which vendor file that just arrived contains an ID mismatch we need to resolve today?
- What is likely to become a problem next?
Both sets of questions are legitimate. Both matter. But they are the outputs of two different layers of software — and no amount of dashboard engineering can make a reporting layer answer operational questions. It’s the wrong architecture.
- Reporting reads from the warehouse. It knows what was.
- Operational intelligence lives above the systems of record. It knows what is.
What breaks when you use a BI tool as the platform
When organizations attempt to run biospecimen operations out of a BI tool, four things go wrong — not because anyone did anything wrong, but because they’re asking the tool for something it wasn’t built for.
1. After-the-fact doesn’t save you time or money. A dashboard that refreshes nightly — even one that refreshes hourly — means every operational decision made against it is based on data that is already stale. Sample missing? You’ll find out tomorrow. Vendor file bad? You’ll see the discrepancy on Monday. Kit shipment delayed? By the time it shows up as a red tile, the study visit is at risk. The dashboard reports the loss; it doesn’t prevent it. Every hour between event and detection is an hour the team spends chasing something that could have been intercepted — and increasingly, an hour that a missing specimen is unrecoverable. The refresh window is the loss window, and it’s where operational budget quietly evaporates.
2. Cross-source reconciliation gets built into a report, not into the system. Every discrepancy report is essentially a query that joins EDC records against lab files against manifests. Those joins are hard, they’re fragile, and they were never meant to be operational logic. The moment a vendor changes their file format, the report breaks silently. The moment a subject ID convention shifts mid-study, the joins produce ghost anomalies. And the fix is a ticket to the BI team, not an update to a rule the operations team owns.
3. There is no verb. A dashboard doesn’t notify. It doesn’t escalate. It doesn’t re-check tomorrow to see if the anomaly cleared. It doesn’t open a discrepancy record, wait for resolution, and close the loop. It just sits there, waiting for someone to open it. Operations is verbs. Reporting is nouns.
4. Nobody in operations owns the logic. Business rules end up encoded inside DAX measures, SQL views, or Tableau LOD calculations — artifacts that live in the BI team’s repo, not in a place where the clinical operations lead can inspect them, change them, or version them. When the protocol amends, the report lags by weeks.
The uncomfortable truth for sponsors: pharma companies pay tooth and nail for this operational workstream, own every byte of the data, and still don’t get to see it until it lands in their warehouse — by which point the decision window has closed and the pivot has become a post-mortem.
What the operational layer actually does — and where SpeciGen fits
None of this is an argument against BI tools. Keep the dashboards. Keep the executive scorecards. Keep the quarterly review decks. Those are load-bearing artifacts of a healthy operation, and BI tools are the right layer for producing them.
The operational layer is a different piece of software that sits between the source systems and the reporting layer — and that many organizations don’t realize is a distinct layer at all.
SpeciGen is built as exactly that: an AI-native operational intelligence platform for biospecimen management. It sits above EDC, CTMS, LIMS, laboratory systems, logistics providers, and biomarker vendors — ingesting their operational signals continuously, encoding the workflow rules that define the study, applying protocol awareness and AI-driven anomaly detection, and surfacing what needs attention while there is still time to act on it.
Rather than replacing your BI tool, SpeciGen feeds it — a clean, reconciled, continuously current view of the operation that any downstream dashboard becomes better for having.
- Continuous ingestion from every study feed — central lab, PK/ADA, biomarker, EDC, LIMS, imaging, courier — not on a nightly cron.
- Deterministic reconciliation rules owned by the clinical operations team, not buried inside a BI extract.
- Protocol-aware anomaly detection that knows the visit windows, the required specimen types, the aliquot map — and flags what a report cannot.
- Verbs, not just views — discrepancies with e-signatures, escalations with owners, resolutions with audit trails.
- Feeds the BI tool, doesn’t compete with it. The dashboards get better data.
- Anomalies surface in seconds, not weeks. As they emerge, not at reconciliation.
- Reconciliation rules live with the operations team. Not inside a BI extract nobody in ops can read.
- Your BI tool keeps its job — and gets better data to work with.
- Every specimen carries a defensible, auditable operational history — from bench to database lock.
The dashboard is a mirror of the operation. It reflects, faithfully, whatever was true when the pipeline last ran. That is a valuable thing. But it is not the operation.